Partial Dependence Plots in Python
December 2, 2018
In writing my undergrad thesis on wealth inequality and using various techniques for predicting it, I found myself disappointed that there was no simple method in Python’s scikit-learn to generate partial dependence plots for random forests. The ability to create partial dependence plots for gradient boosted regressors exists, so why not for random forests, or anything else for that matter? In this post, I’ll discuss partial dependence plots, what they are, how they’re useful in ensemble methods, and dive into the state of the art for partial dependence plots in Python.
What’s a partial dependence plot?
A partial dependence plot is an attempt to open up the black box of ensemble methods. Normally, we can compute the importance of a given variable in estimating the response varaible, but do not have a great intuition as to the decision surface of even the most important variables. Partial dependence plots allow us to see the marginal effect of a given variable on the response variable by integrating out all of the other variables. They allow us to see the effect of a single variable on the response variable, which is otherwise not possible in ensemble methods. Thus, they’re a very powerful tool. Some say ensemble methods are being left by the wayside in 2018 for ever more complicated neural nets, but ensemble methods continue to provide a powerful and much more interpretable option for both regression and classification thanks to partial dependence plots. Also, recent research has shown that with some alterations ensemble methods can be used for treatment effect estimation, which is an extremely promising line of inquiry to me. Now let’s see what they look like!
State of the code: Python
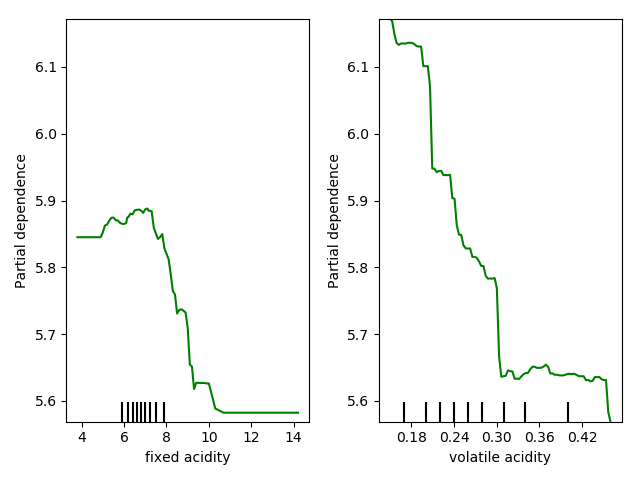
There’s been motion on the topic of partial dependence plots since 2015 within sklearn, as well as some external work by a number of sources on creating a generalized partial dependence plot library</a> that can connect to the extant classifiers and regressors. I decided to test each of these tools out. The sklearn partial dependence plot is still going through edits, but it performs admirably, creating simple R-style partial dependence plot matrices.

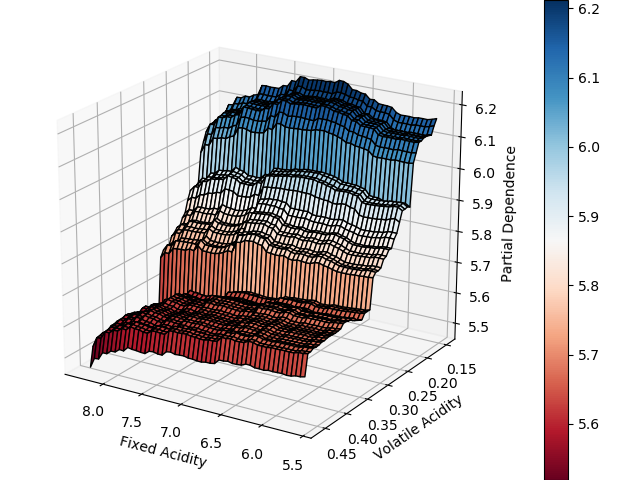
The code also extends easily to create three dimensional partial dependence plots, should that tickle your fancy. Not normally my cup of tea, but in this case it allows for a more pithy data visualization and efficiently demonstrates variable interaction.

What’s more, this tool, if implemented, would be integrated seamlessly into the most commonly used Python machine learning library and would be a plotting option for every single ensemble method within sci-kit learn. That’s big.
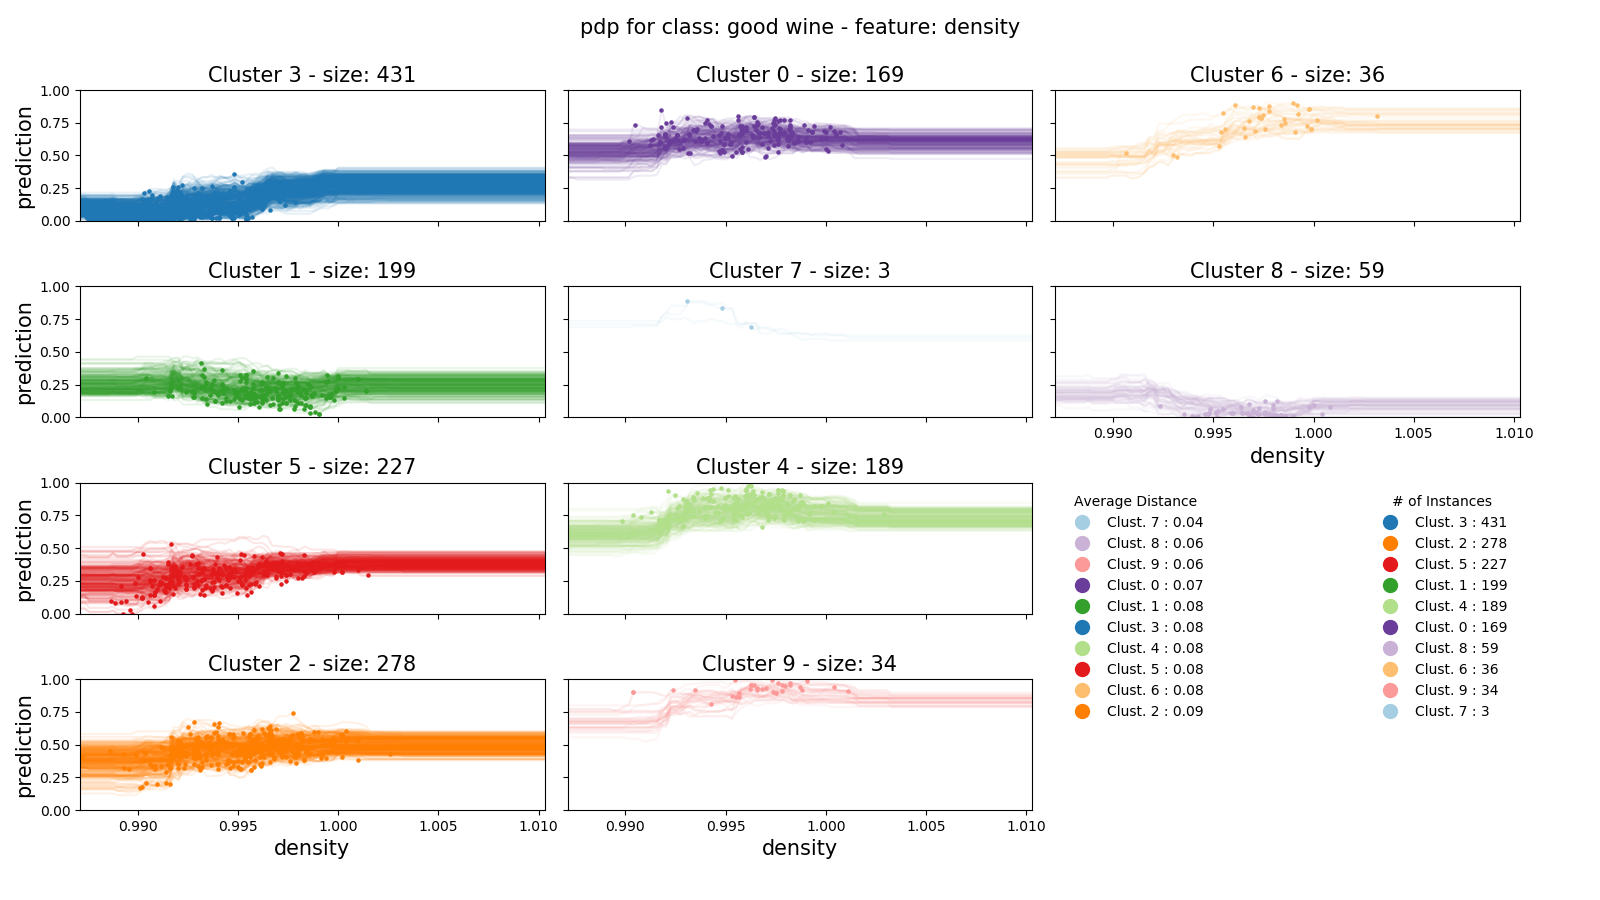
A more established and feature-rich Python library for plotting partial dependence is the NYU Visualization Lab’s ‘partial_dependence’. It offers an abstraction of matplotlib with its pdp_plot object, with which you can calculate partial dependence, clusters, and plot. I’m particularly a fan of the automated clustered pdp plot with full curves. Since I’m using random forests for each of these examples, I get a slightly jittery plot, but this plot is very easy to create and effectively demonstrates the partial dependence of the a wine’s density on its score.

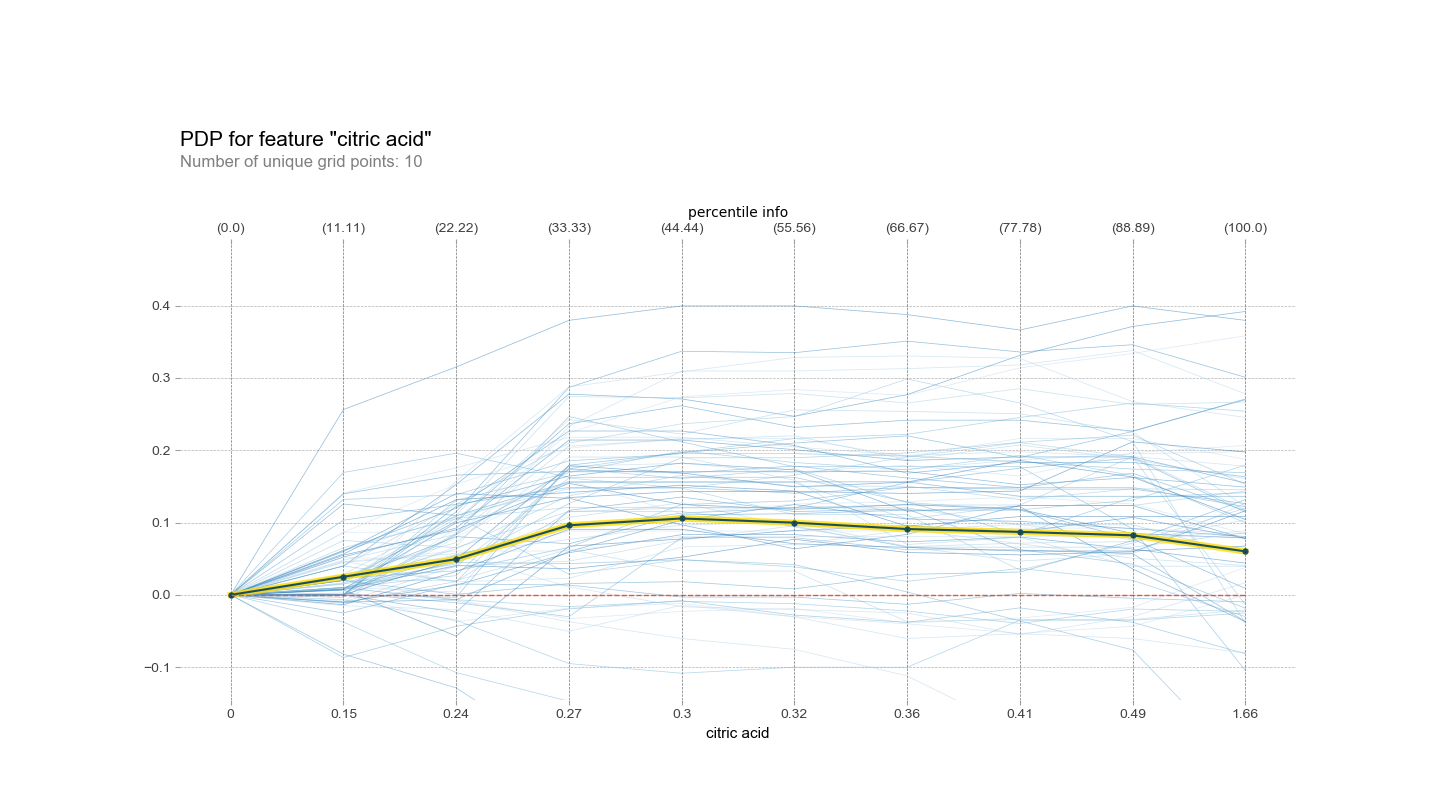
Finally, PDPbox. It also supports As of typing this, the pdp_interact_plot functionality appeared to be broken for the default option, contour plots, due to a recent change in matplotlib. In fact, there are a number of functionalities that aren’t working as expected due to changes in other packages, so if using this packages keep that in mind. The implementation for creating simple PDPs in this package is through pdp_plot, which is what I use below to look at the effect of the pH of the wine on the quality. It’s fairly feature-rich, allowing you to select whether to cluster, how to cluster, how many lines to show, etc. all in one function call.

Ultimately, all of these libraries are great options for creating tasetful and informative partial dependence plots. It comes down to the degree of extendability and aesthetics. If you want a package that is supported by the biggest machine learning library in Python, follow the threads on the SklearnPDP pull request. If you like the stylistics of the NYU partial_dependence package and would like a lot of the matplotlib details abstracted away, it’s a fantastic option. If your ideal partial dependence plot is more professional-looking, give PDPbox a whirl. Like a kid in a candy shop, you can’t go wrong, it’s all about preferences.